The Graph View
The Graph View draws your graph as a picture. Every page, journal entry and linked name is a dot, and every pair joined by a wikilink (see Pages And Wikilinks) is a line between them. It shows what your notes connect to, which ideas you keep coming back to, and which pages nothing links to yet.
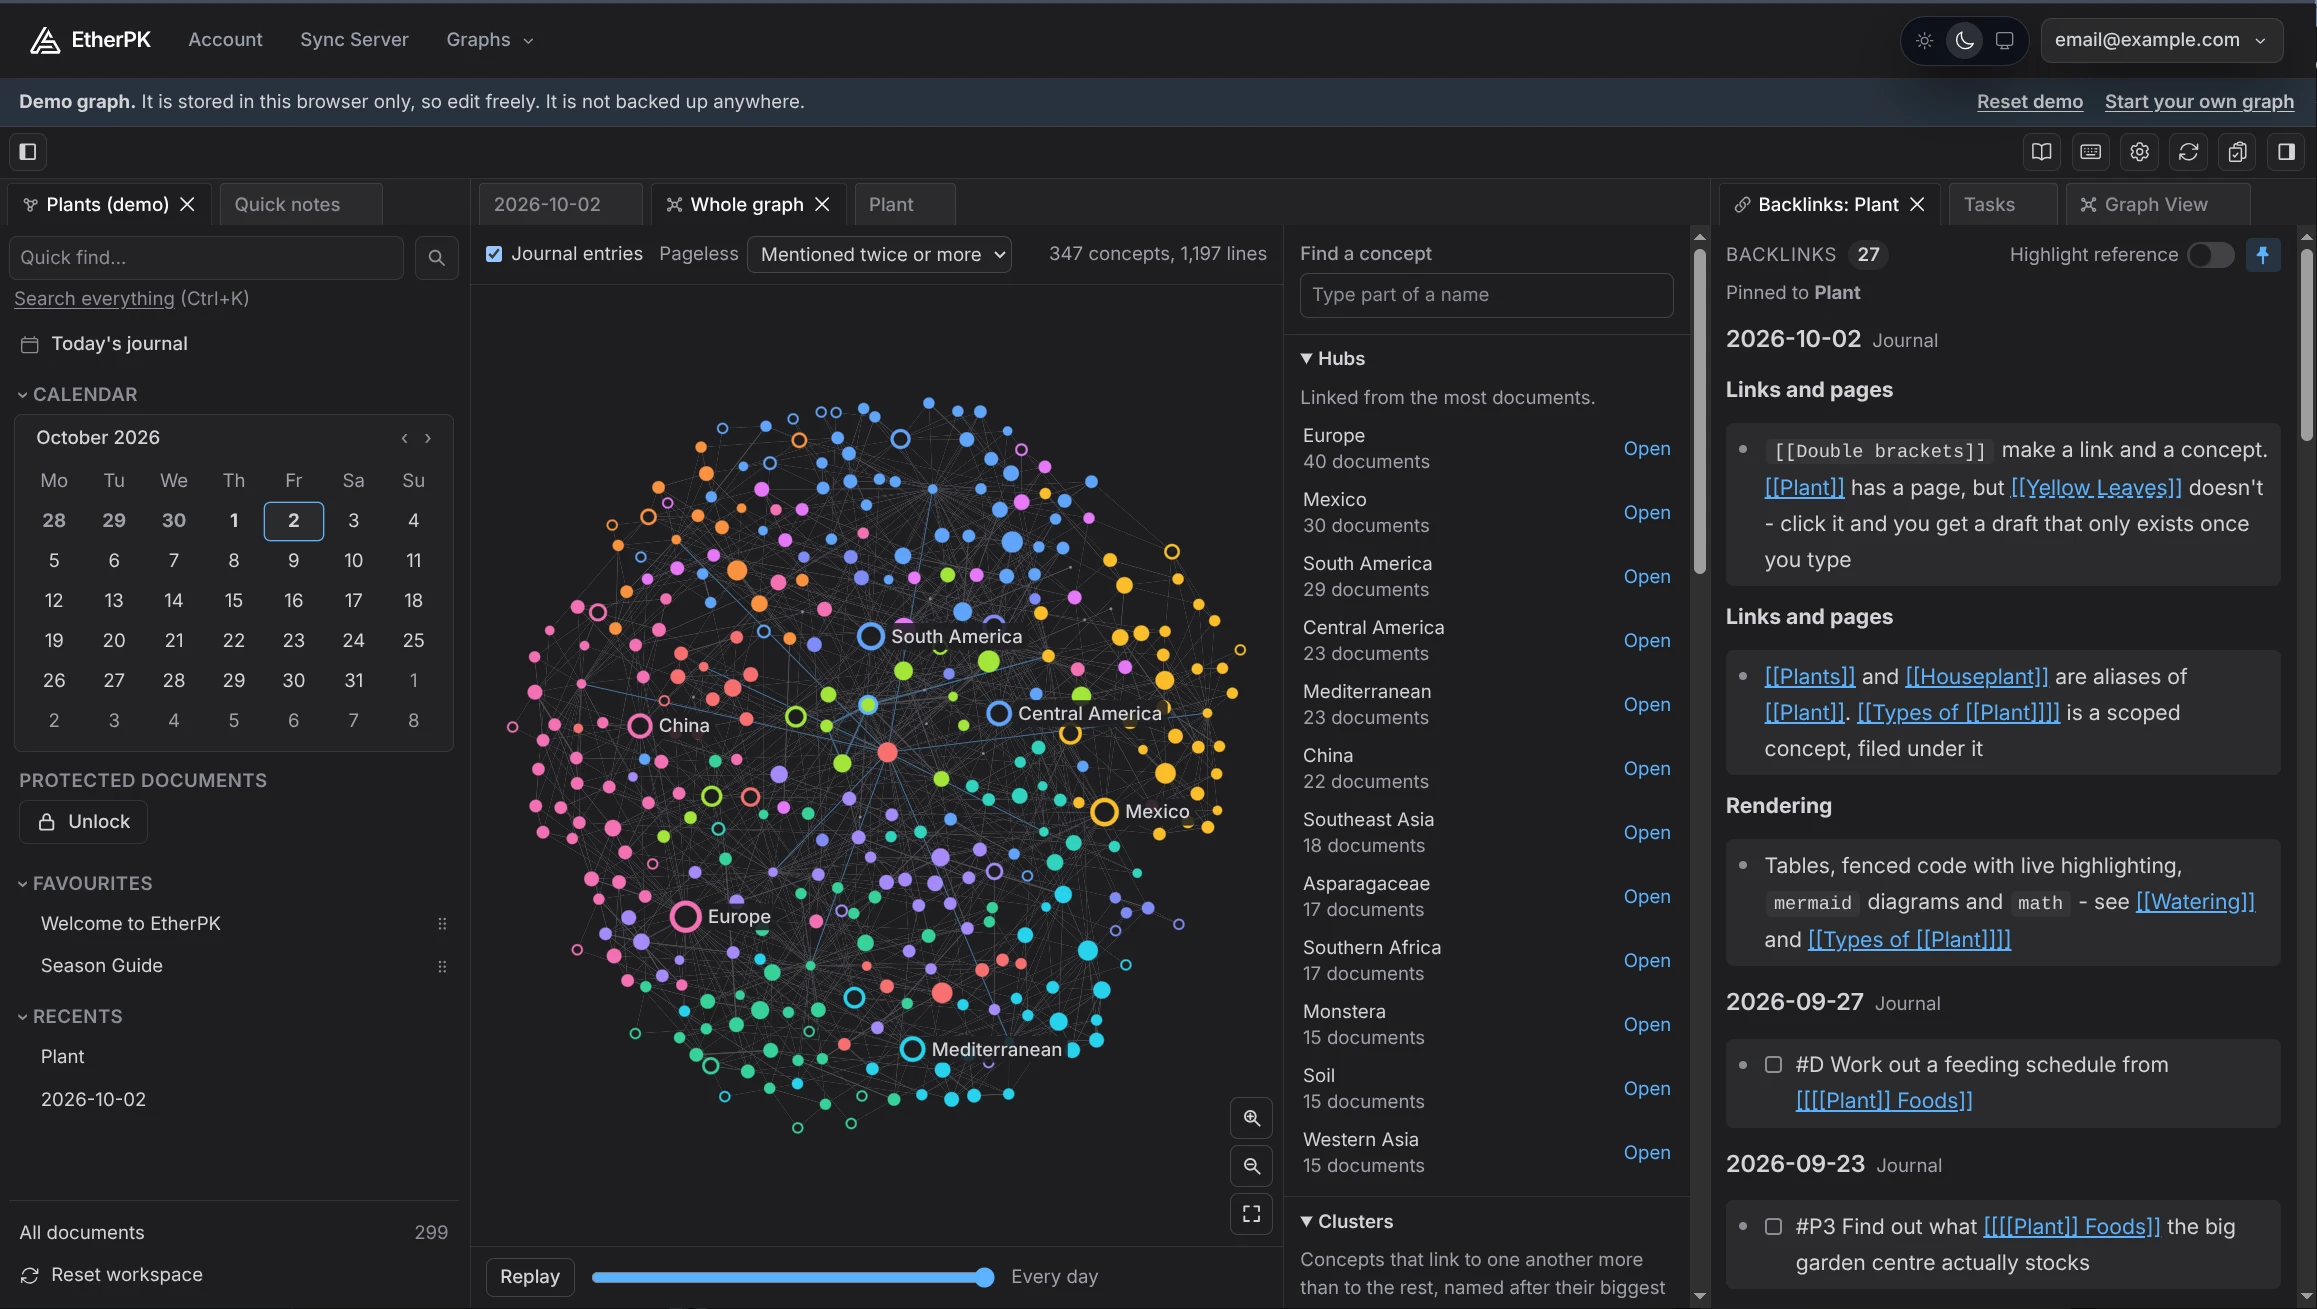
There are two copies. The right sidebar has a small one that shows the document you are working on and what is around it. The whole graph opens in a tab of its own, with lists beside the picture that name what it shows.
The Graph View is for a desktop or a wide window. On a phone it isn't in the sidebar, and a Graph View that is already open says it needs a wider window.
The Graph View is an extension that comes with EtherPK. Settings and Extensions → Extensions switches it off on a device where you don't want it (Graph Settings).
The Graph View in the sidebar
The Graph View is the third tab of the right sidebar, after Backlinks and Tasks. Alt+M brings it to the front from anywhere. It draws the document in front of you in the accent colour, the documents it links to and the documents that link to it, and follows you as you move between documents.
- Steps sets how far out it reaches. At 1 it shows what is linked directly, and at 2 or 3 it shows what those link to as well.
- Journal entries shows or hides the days that mention the document.
- Shown here lists everything in the picture, closest first. Choosing a name opens that document, as clicking its dot does.
- Whole graph opens the whole graph.
The whole graph
The whole graph opens in the main area as a tab called Whole graph. Open it with Whole graph on the sidebar copy, or right-click a document tab or a link and choose Show in Graph View, which also picks out that document, or the one the link names, and what it links to. The tab has its own address, so Back and Forward return to it and a bookmark opens it.
Clicking a dot, or the Open button on a row of the lists, opens its document as a new tab in the whole graph's pane. The whole graph's own tab brings the picture back. A document that is already open in another pane comes to the front there. Hovering a dot picks it out with everything it links to. The buttons in the corner zoom in and out and fit the whole picture back in view.
- Journal entries shows or hides journal entries.
- Pageless chooses which pageless concepts (names that are linked but have no page yet) to draw. By default it draws only those mentioned in two or more documents, because most are mentioned once and drawn they bury everything else.
- Find a concept moves the picture to a name you type.
What the picture shows
- Size. A dot is larger the more documents link to it.
- Colour. In the whole graph, a dot's colour is its cluster (see below), and a dot in no cluster is grey. In the sidebar, the document in front is in the accent colour and the rest are plain. Journal entries are small grey dots in both.
- Rings. A pageless concept is drawn as a ring, because there is no page behind it yet. The document you are working on wears a ring in the accent colour.
- Lines. A line is thicker when one document mentions the other many times. A tinted line joins
a page to the concept its name is scoped by, such as
[[Physics]] Wavesto Physics (see Scoped Concepts).
A protected document appears by its name, with lines from the documents that link to it but none from it, whether or not it is unlocked, because what it links to is part of its protected text (see Protected Documents).
The lists beside the whole graph
Each list is something you can act on. Choosing a row picks it out in the picture, and Open opens its document.
- Hubs are the concepts linked from the most documents, counted by documents rather than mentions. These are what your graph is about, and they deserve good pages.
- Clusters are groups of concepts that link to one another more than to the rest, named after their biggest hub. Nothing is filed into a cluster: they are worked out from your links each time the picture is drawn. Choosing one picks out its members.
- Bridges are concepts that carry most of the links between two clusters. They are often where two areas of your thinking meet.
- Pageless concepts are the names mentioned in the most documents that have no page yet. Opening one starts its page.
- Isolated documents are pages with no wikilinks in or out. Link them to something, or decide they don't need to be in the graph.
- Path finds the fewest steps between two concepts through what the picture shows, and picks out the route.
Replaying how your graph grew
Replay, under the whole graph, steps through your journal days from the first to the last and shows the graph growing as it goes. Drag the slider to stop on a day, and Show all returns to today.
Journal days are the only dates EtherPK has for your notes, so the replay dates everything by them. A concept appears on the first day a journal entry links to it, and a journal entry appears on its own day. Pages that no journal entry ever mentions are there from the start.
Your agent can read it too
An AI agent connected through The Headless Client has two tools that answer the same questions as the lists: one for the hubs, clusters, bridges, pageless concepts and isolated documents, and one for the path between two concepts. Ask it something like "what topics in my notes have no page yet?" or "how is my garden page connected to my budget?".
It costs nothing while you aren't looking
The Graph View does no work while it is behind another tab, while the sidebar is closed, or while EtherPK's window is hidden. It catches up once when you look at it again. The code that draws it isn't even downloaded until the first time it is on screen.